Telemetry Nerd
Evidence-first telemetry analysis for you and your agent.
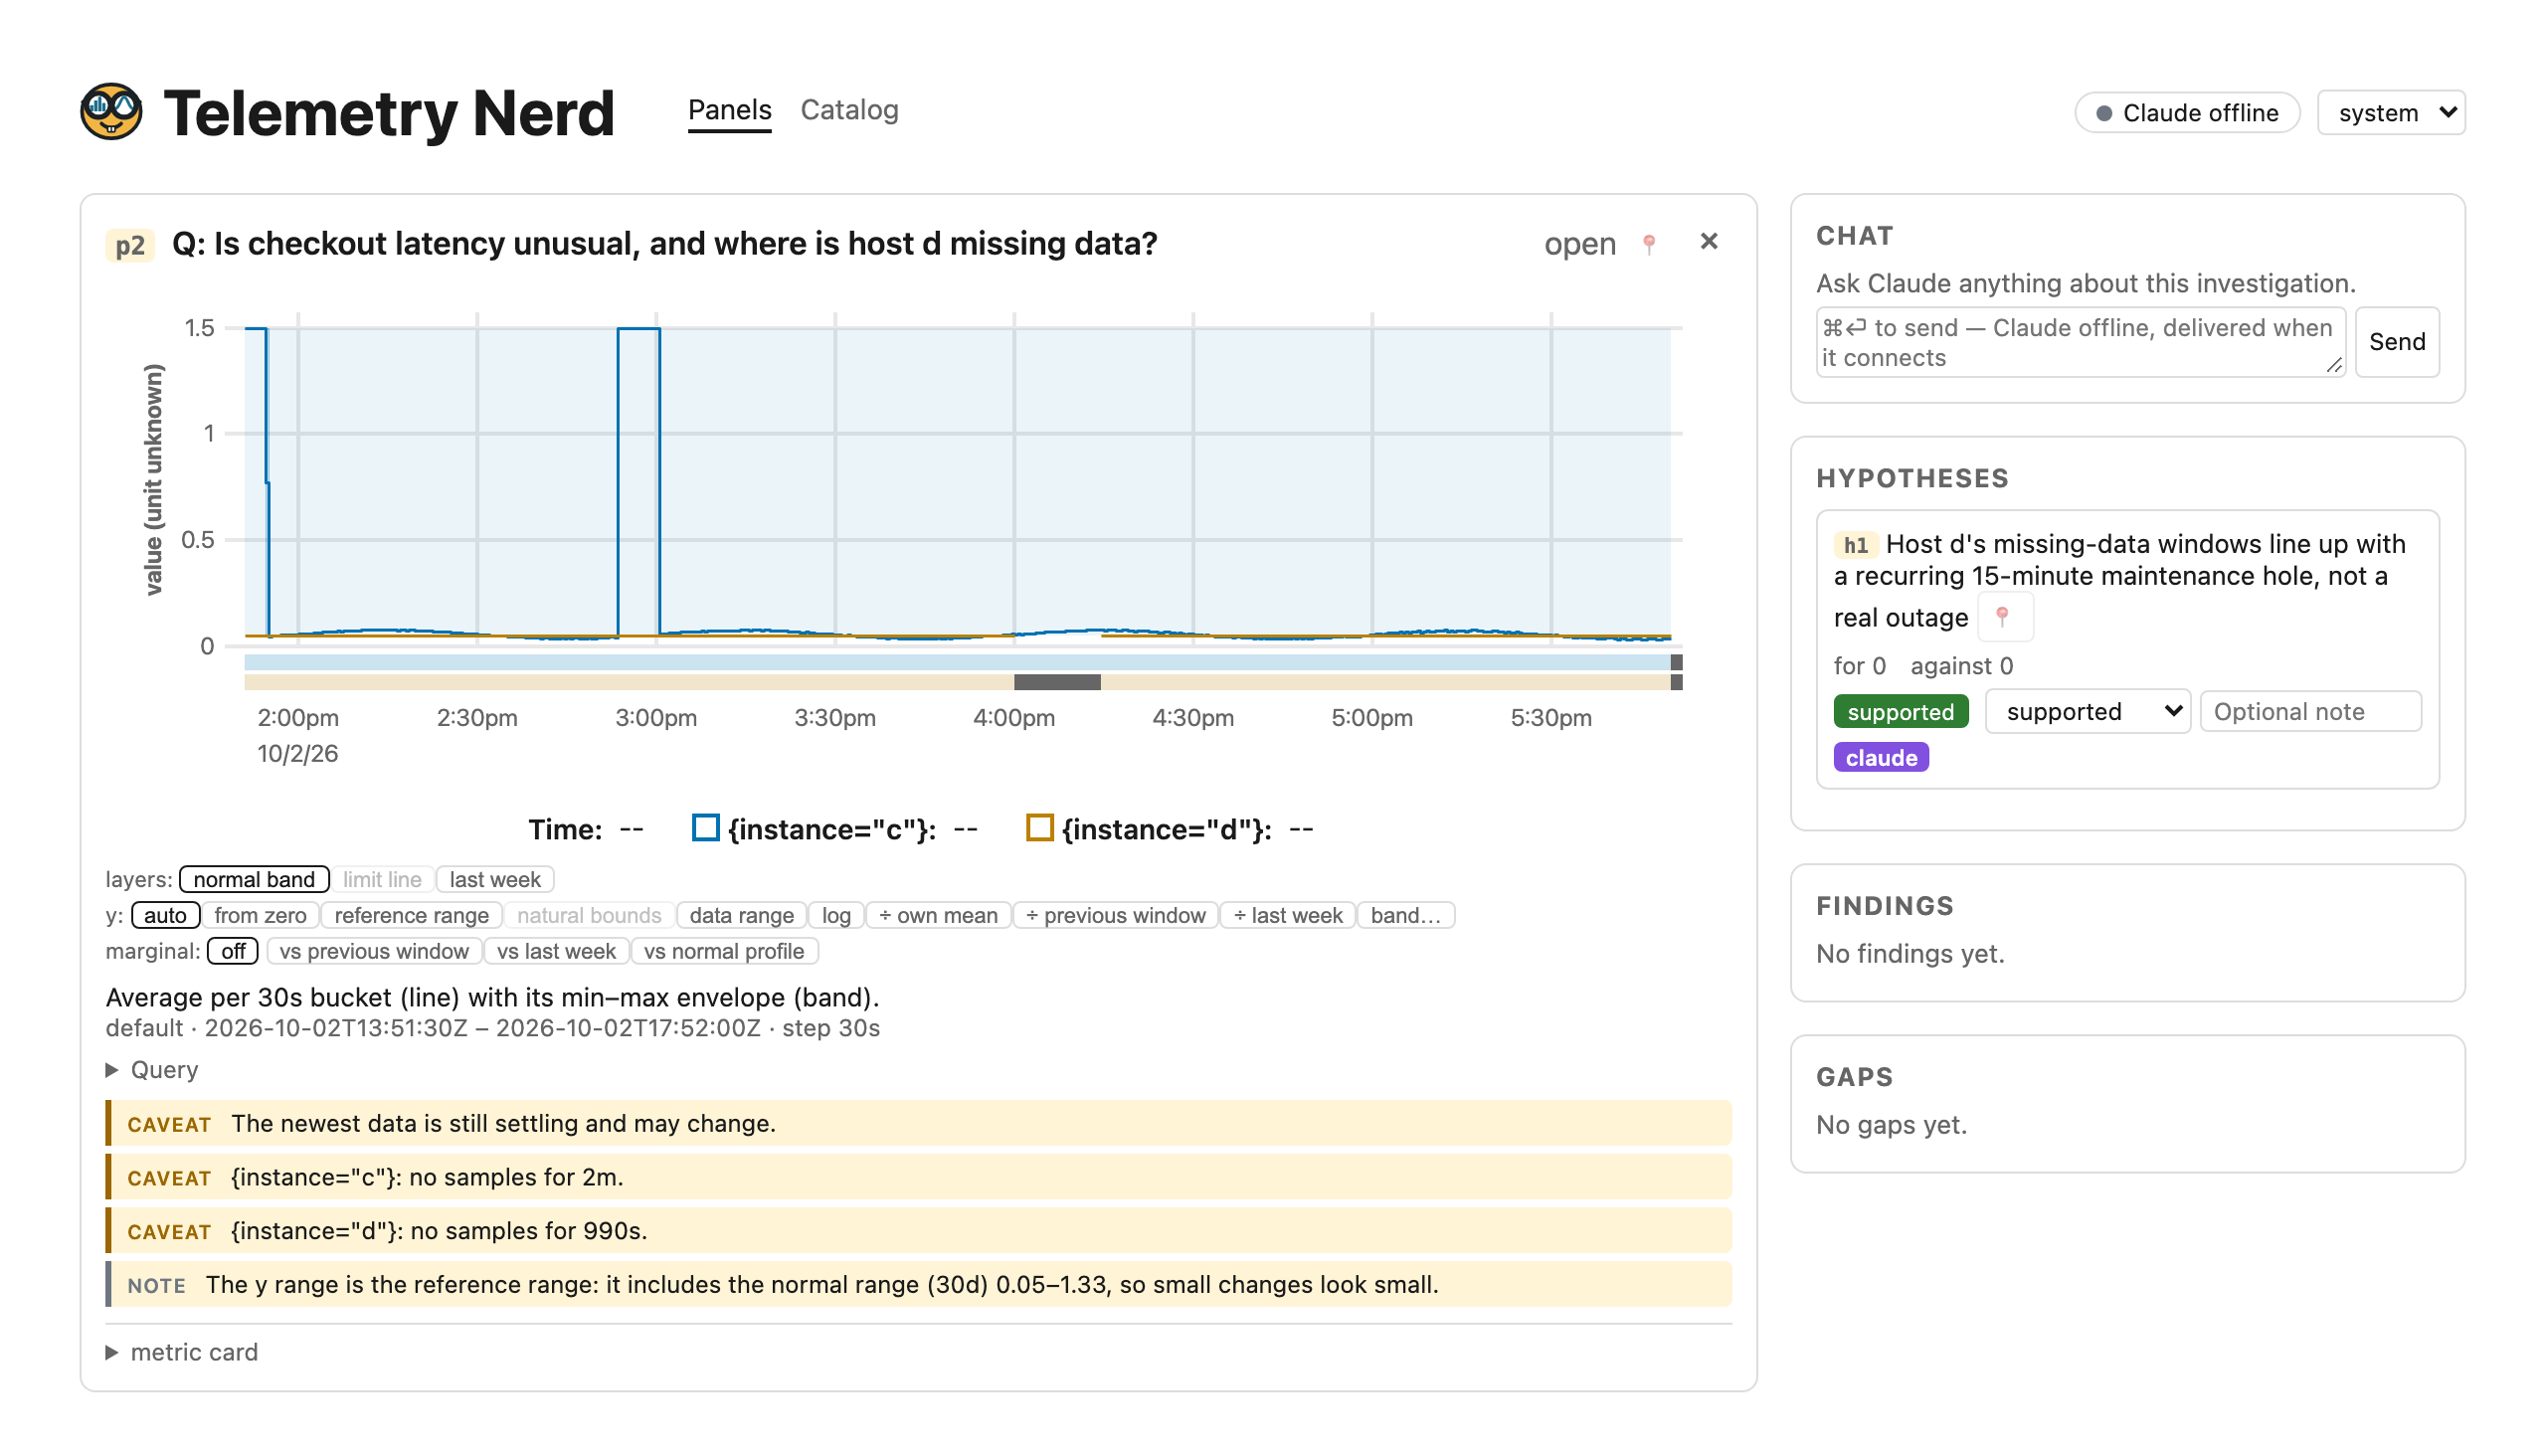
Telemetry Nerd is a workspace where you and Claude investigate your metrics together. Claude queries your datasource (Prometheus, VictoriaMetrics, Thanos, Mimir and more), draws graphs into a shared browser workspace, and writes down what it thinks is going on as hypotheses and findings. Every finding points at the evidence behind it. You see the same graphs, ask about any part of them, and mark hypotheses supported or refuted.
It is, and it isn’t
It is an analysis workspace for people who need to understand what their systems are doing: during an incident, in a capacity review, or when a graph looks wrong.
It isn’t an “AI SRE” that does automated root-cause analysis, a dashboarding tool, or an alerting system. Root-causing a real incident takes judgment a tool doesn’t have; claiming otherwise is snake oil. Telemetry Nerd proposes and gathers evidence — you conclude. It’s a powerful tool for people who already know how to debug, built to stay humble about what it can’t do. Read the rationale for why that boundary, and the rest of the design, is deliberate.
What you can do with it
- Ask questions in plain language and get graphs that each answer one stated question.
- See whether a metric is unusual for this time of day or week (seasonal comparison).
- Find cycles in a series with periodograms and spectrograms.
- Compare distributions across time windows, and count exactly how many requests crossed a latency threshold.
- Analyse many series of one metric as a fleet: the spread across hosts, and which members are outliers, instead of a hundred overlapping lines.
- Keep track of the investigation: hypotheses, findings, open questions and annotations, all in one place that both you and Claude can see.
It works with any Prometheus-compatible source. No setup needed to try it — Claude can connect to several public demo sources (Grafana Play, Wikimedia, the VictoriaMetrics playground and more).